
Your SaaS is working.
Your revenue isn't.
We diagnose why users don’t convert, activate, or stay – and show exactly what to fix inside your product. Stop guessing. Start fixing.
Trusted by engineering team at
01 // THE SYMPTOMS
Why SaaS Products Lose Users
(Even When Everything Looks Fine)
You don’t have a data problem. You have a decision problem.
The Conclusion
If you’re fixing UX when the problem is workflow friction, you are solving the wrong problem.
False Positives
Analytics shows high activity, but revenue doesn't grow. You're tracking noise, not value.
The Ghost Town
Users complete onboarding, set up their profile, and then disappear forever.
Feature Fallacy
New features are shipped on time, but adoption stays flat. The core loop is broken.
02 // THE SOLUTION
Product Performance Diagnosis
We don’t redesign your product. We fix what’s blocking revenue.
Revenue Leakage Audit
Live Data
Live Data
Last 30 Days
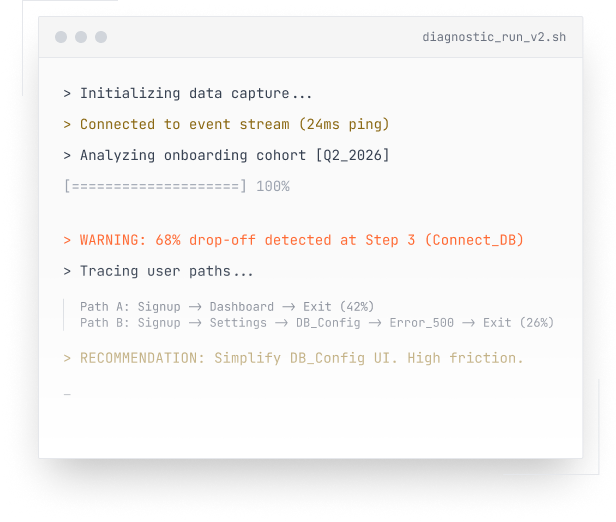
Activation drop-off
42.8%
-12% vs previous period
Time to first value
14d 2h
Target: < 3d
EST. revenue leakage
$84.2k
Monthly recurring impact
03 // The method
What We Actually Do
A systematic, non-consulting approach to finding revenue leaks.

Behavioral Analysis
How users actually behave vs how you think they behave.
Data Deconstruction
Remove noise from dashboards to isolate real signals.
Workflow Mapping
Identify exactly where users get stuck, confused, or drop off.
Pattern Recognition
Compare with real SaaS failure patterns, not theory.
Priority Fixes
What to fix first to impact
revenue, not UX cosmetics.
Data Doesn't Tell You What to Fix
Most SaaS teams already have dashboards, analytics, and AI tools. But they still can’t answer one critical question:
- High signups, low activation
We don’t add more data. We remove noise and make decisions clear. You act as the decision clarity layer between raw data and product actions.
When You Need This
- High signups, low activation
- Users log in once and disappear
- Good UX, weak retention
- Flat growth despite new users
- "We tried everything" situations
01 // The symptoms
Deliverables
- Product diagnosis report
- User behavior breakdown
- Friction points (top 3–5)
- Prioritized fix roadmap
- Strategic recommendations
05 // The impact
What Changes After
+30–40%
More users become active within the first 7 days.
Clear Priorities
Stop guessing what to build next. Know exactly what blocks revenue.
Reduced Churn
Eliminate the specific friction points causing early drop-offs.
Team Alignment
Bridge the gap between product
decisions and revenue outcomes.
Let's Find What's
Actually Broken.
We don’t redesign your product. We fix what’s blocking revenue. Book a diagnostic call to
identify your retention gap.
No generic frameworks. No “add AI” advice. No feature guessing.
Lets's Find What's
Actually Broken
We dont redesign your product.We fix what’s blocking revenue
Direct Contact