
The market is expanding in dollars while contracting in breadth.
On the surface, 2026 looks like one of the strongest years venture capital has ever seen. Funding has surged, valuations have climbed, and exit values have reached levels that would have looked almost impossible a few years ago.
But the deeper you go into the data, the less the headline numbers tell you about the actual market.
In Q2 2026 alone:
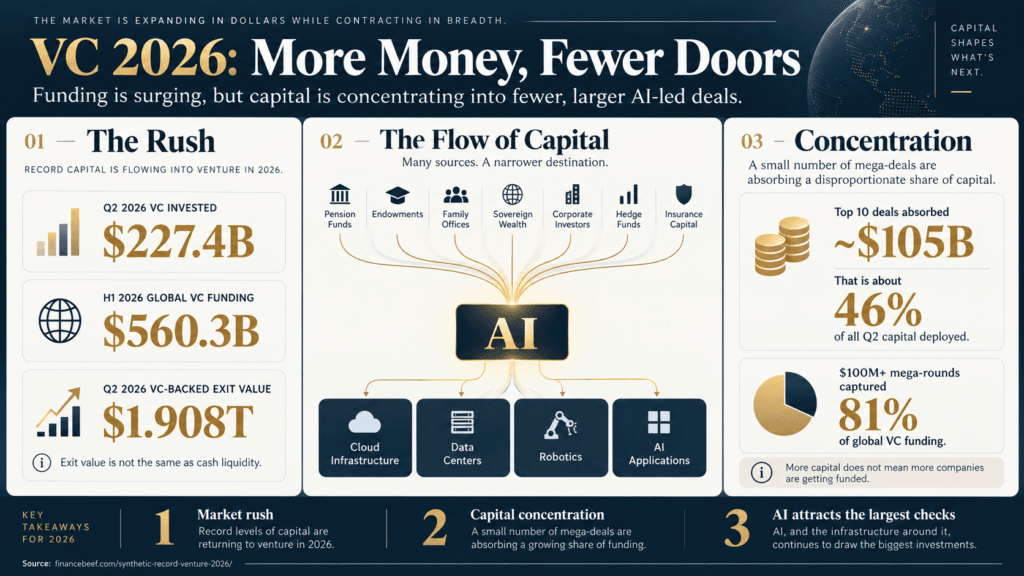
- $227.4 billion was invested globally in venture capital.
- Just 10 deals accounted for roughly $105 billion, or about 46% of all capital deployed.
- CB Insights reports that mega-rounds of $100M and above absorbed 81% of global VC funding.
- At the same time, global deal activity remained historically weak, at what CB Insights calls its “lowest point in over a decade.”
- Global VC-backed exit value reached approximately $1.9 trillion in a single quarter, yet the number of exits did not rise with it: 811 in Q1 and 775 in Q2 as first published.
So the market is not simply growing.
Capital is concentrating.
More money is being deployed, but increasingly into fewer companies, larger rounds and later-stage assets. And that creates an uncomfortable question for investors:
Are we looking at a venture recovery, or are a small number of extraordinary companies making the entire market look healthier than it really is?
That distinction matters. Record funding does not automatically mean more investable opportunities. Record exit value does not automatically mean record liquidity. And rising private-market valuations do not automatically mean better future returns.
The numbers are real. The story they appear to tell is not always the real one.
- Did liquidity actually return? The $1.9 trillion that was not cash
- Is venture booming, or concentrating? More dollars, fewer doors
- How do I get access to the growth? Private access is changing, not disappearing
- Am I overpaying? What investors are paying by stage today
- Which manager metrics matter now? Realised against marked performance
- How do I choose one deal? What the data cannot tell you
- Global venture-backed exit value reached $1.908 trillion in Q2 2026, according to KPMG Venture Pulse Q2 2026, p.14.
- KPMG attributes about $1.8 trillion of that quarter’s exit value to the United States, and roughly $1.7 trillion of the US figure to public listings.
- PitchBook values an IPO exit at the company’s valuation at the IPO price, not at the cash raised in the offering, as stated on p.99 of the KPMG Venture Pulse Q2 2026 methodology.
- SpaceX raised $75 billion in its listing, rising to $85.7 billion after the full over-allotment option was exercised, according to KPMG’s Q2 2026 press release.
- Global venture funding was $560.3 billion in the first half of 2026, more than any full year on record except 2021, per KPMG Venture Pulse Q2 2026, p.7.
- The ten largest venture deals of Q2 2026 accounted for $105 billion of $227.4 billion invested globally, roughly 46% of all capital deployed that quarter, per KPMG.
- CB Insights, using an independent database, reports that rounds of $100 million and above captured 81% of global venture funding in Q2 2026, in a quarter it describes as the lowest deal count in over a decade.
The $1.9 Trillion Exit Record That Wasn’t $1.9 Trillion of Cash
Did liquidity actually return?
Venture capital supposedly produced $1.9 trillion of exits in one quarter. That sounds like liquidity came roaring back.
It did not.
In Q2 2026, KPMG and PitchBook recorded $1.908 trillion of global venture-backed exit value, more than the previous full-year record of roughly $1.5 trillion set in 2021. About $1.8 trillion came from the US, with roughly $1.7 trillion attributed to public listings.
But there is a catch. Exit value is not the same thing as cash returned to investors.
PitchBook values a public-market exit using the company’s valuation at the IPO price. It does not simply count the cash raised in the offering.
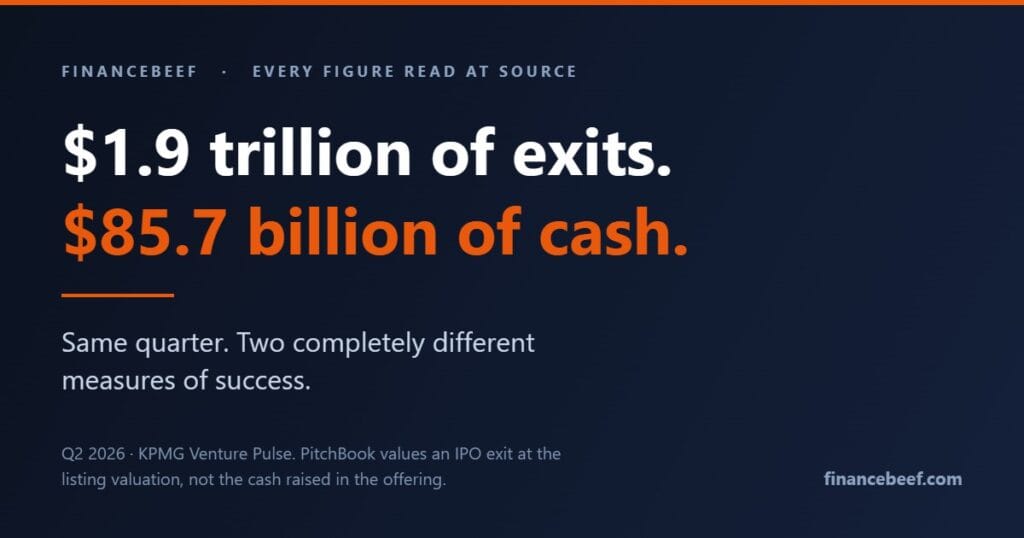
SpaceX makes the distinction almost impossible to ignore. KPMG reports that the company raised $75 billion in the offering, rising to $85.7 billion after the underwriters exercised the full over-allotment option. Yet the quarter still produced roughly $1.7 trillion of US public-listing exit value, with SpaceX as the dominant driver.
So one quarter can simultaneously produce $1.7 trillion of reported public-listing exit value and $85.7 billion of actual SpaceX IPO proceeds.
Those are not competing numbers. They measure completely different things.
And that difference matters, because an investor looking at the first number may conclude that liquidity is back. The better conclusion is narrower: public-market valuations are back, and realised liquidity has to be measured separately.
Why this matters for your money
A portfolio can look dramatically healthier because one large company received a public-market valuation. That does not mean LPs received equivalent cash distributions. It does not mean every shareholder sold. And it does not mean the rest of the venture market suddenly became liquid.
So when a manager tells you exit value has exploded, the next question is not how big the exit was. It is how much cash actually came back.
Annual VC-backed exit value, $B. Quarterly labels read in KPMG Venture Pulse Q2 2026, p.14; annual totals are our sums, as the report prints none. 2026 is a half-year and is not comparable with the full years beside it.
Data note: PitchBook changed its exit-value methodology in 2020, expanded IPO classification to include SPACs and reverse mergers in 2021, and introduced a new M&A extrapolation in 2025. Historical comparisons should be interpreted with caution.
| Period | Exit value |
|---|---|
| 2020 | $622.4B |
| 2021 | $1.528T |
| 2022 | $465.3B |
| 2023 | $341.1B |
| 2024 | $342.7B |
| 2025 | $563.8B |
| H1 2026 | $2.343T |
The strangest part is that H1 2026 alone is already roughly 1.5 times the previous full-year record. But that does not mean venture investors received $2.3 trillion in cash. It means the valuation methodology produced $2.3 trillion of VC-backed exit value. That is a very different statement.
KPMG says the quarter was “heavily skewed by the merger of SpaceX and xAI, and then the subsequent IPO of the combined company.” SpaceX had acquired xAI in Q1 2026 for $250 billion.
Nothing is wrong with the metric. The problem begins when valuation is mistaken for liquidity.
A record exit-value number can tell you that valuations recovered without telling you that liquidity recovered. That is the whole point of this section.
If you are allocating: never accept an exit-value figure without asking what share was realised in cash. When a manager or a market report leads with exit value, the follow-up question is what was distributed, to whom, and when.
If you are raising: a headline valuation at a comparable company’s listing is not what its shareholders received. Model your own outcome from the cash terms and the preference stack.
More Dollars. Fewer Doors.
Is venture really booming, or just concentrating?
If the $1.9 trillion exit record made venture look more liquid than it really is, the funding numbers create a second illusion: more money does not necessarily mean more opportunity.
Global venture funding reached $560.3 billion in the first half of 2026, according to KPMG and PitchBook. That is more capital than venture received during the entire years of 2022, 2023, 2024 or 2025. Only the 2021 boom was larger. And 2026 had only used six months.
Global VC funding, $B. 2026 represents H1 only. Source: KPMG Venture Pulse Q2 2026, p.7. Annual totals are calculated from the quarterly figures reported by KPMG and PitchBook.
At first glance, that looks like a historic recovery. Then you look at who is actually receiving the money.
CB Insights, using an independent venture database, describes Q2 2026 as the quarter when global deal count fell to its “lowest point in over a decade.”
So we have two things happening at the same time: record-level capital deployment, and historically weak deal activity.
That is not a contradiction. That is concentration.
And the concentration becomes even harder to ignore when you look inside the headline number. In Q2 2026, KPMG and PitchBook recorded $227.4 billion of global venture investment. The ten largest deals alone absorbed approximately $105 billion. That means roughly 46% of all venture dollars deployed globally in the quarter went into just ten companies.
CB Insights sees the same phenomenon through a different dataset: $100M+ mega-rounds captured 81% of all global venture funding in Q2.
This changes the meaning of the boom. The market is not necessarily producing dramatically more investable companies. It is producing dramatically larger cheques for a much smaller group of companies.
A rising market can expand your opportunity set. A concentrating market can do the opposite.
You may see record amounts of capital entering venture while finding that the companies responsible for those records are already held by top-tier funds, priced at premium valuations, heavily oversubscribed, or simply unavailable to you.
So the real question is not how much money is going into venture. It is: how much of that market can you actually invest in? That is a very different question.
The number we refuse to pretend is precise
There is another statistic that appears to strengthen the same argument. KPMG reports 811 VC-backed exits in Q1 2026 and 775 in Q2, apparently a 4.4% decline. It would be convenient to write that exit activity is falling while exit values explode.
But we cannot defend that conclusion yet.
Private-market databases continue discovering and confirming transactions months after a quarter closes, and the revisions can be enormous. KPMG’s initially published Q1 2026 global deal count was 8,464. In the next data vintage, the same quarter appeared as 10,277 deals. That is not a rounding difference. It is more than 1,800 additional transactions appearing after first publication. Q2 2025 was similarly revised from 7,356 to 8,860, while Q1 2026 exit value moved from $413.5 billion to $434.7 billion.
So a reported 4.4% change in exit count is simply too small to treat as a confirmed trend when the underlying database has recently experienced double-digit revisions.
The $1.9 trillion exit-value spike is different. A move from $434.7 billion to $1.908 trillion is far too large to disappear through normal database revisions. One conclusion is robust. The other is not. And knowing the difference is part of investing.
Do not confuse capital abundance with opportunity abundance. When funding rises, ask whether deal count is rising with it. Then ask where the additional dollars are actually going. If most incremental capital is being absorbed by mega-rounds and a handful of late-stage companies, you may be participating in a very different market from the one the headline describes.
The same discipline applies when evaluating funds. A reported valuation, portfolio mark or market statistic is only as useful as its date, methodology and comparability. Before interpreting any change, ask one question: was the previous period restated?
Because in private markets, sometimes the trend changed. And sometimes the database did.
Private access is not disappearing. It is splitting in two.
How do I get access to the growth?
There is a popular version of this argument that says venture funds are dying and money is fleeing the asset class. The data does not support it.
NVCA, reporting on the same quarter, says fundraising “rebounded sharply, with venture firms raising nearly as much capital through June as during all of 2025” and that exit activity improved, offering “encouraging signs that liquidity conditions may finally be strengthening.”
But read the qualifier, because that is where the story is: commitments “remained concentrated among a small group of established managers,” and “strong headline numbers continue to mask significant concentration across investment, fundraising, and exits.”
Meanwhile the structural routes into private companies are expanding, not contracting. The two tables below set the sides of that split next to each other, each with its own scope, because they come from different providers measuring different markets.
And the companies themselves stay private longer. The aggregate value of US unicorns is $4.3 trillion. PitchBook’s own comment on that figure is the clearest statement of this shift we have found:
The private market is becoming harder to access conventionally and easier to access structurally. Those are not the same thing.
Side one: conventional access is concentrating
| Figure | Value | Vintage |
|---|---|---|
| US VC fundraising, 2025 | $66.1B across 537 funds, lowest since 2018 | Q4 2025 |
| 2025 fund count against the 2021 peak | 30% | Q4 2025 |
| Andreessen Horowitz, January 2026 close | $15B, more than 18% of all new US VC commitments since January 2025 | Q4 2025 |
| Net cash flows to US limited partners since 2022 | almost $200B negative | Q4 2025 |
| H1 2026 fundraising | nearly as much as all of 2025, concentrated among established managers | Q2 2026 |
One firm took more than eighteen cents of every new dollar committed to US venture funds over a twelve-month period. That is the concentration story on the fund side, and it is the reason a rebound in the aggregate can coexist with a first-time manager failing to close.
Side two: structural access is expanding
| Figure | Value | Scope |
|---|---|---|
| Secondaries transaction value, 2025 | $240B, a record, up 48% | Global PE |
| GP-led secondaries volume, 2025 | $115B | Global PE |
| GP-led secondaries volume, 2020 | $35B | Global PE |
| Sponsor-backed exits passing through continuation vehicles | about 14% | Global PE |
| LPs describing continuation-vehicle assets as distressed or challenged | about 30% | Survey of 300 LPs |
GP-led volume more than tripled in five years. That is not a workaround that appeared during a bad patch. That is infrastructure being built.
The last row is the one to keep in view. A wider set of doors is not the same as a better set of doors, and the people already walking through them are not uniformly happy about what is on the other side.
Put plainly: traditional access is concentrating in established funds, while secondaries, continuation vehicles, direct deals and SPVs are becoming permanent infrastructure rather than workarounds. The IPO is increasingly a liquidity event after years of private value creation, rather than the starting line for public investors. By the time public markets gain access, a materially larger share of a company’s growth may already have happened.
If you are allocating: the access question now matters more than the manager-selection question. Compare a blind-pool commitment against secondaries, continuation vehicles and direct positions on three axes: when capital is called, when you can sell, and what you can see about the underlying company. Structural access is wider, not automatically better, and the last row of the second table is the reason to stay careful.
If you are raising: if your investor is not among the established managers absorbing the rebound, their next fund is a live question. Ask what year the current fund closed, how much is deployed, and whether reserves are allocated for follow-ons.
What investors are paying today
Am I overpaying?
Global medians for 2026 to date. This is the table to price against.
Logarithmic scale: each gridline is ten times the one below. The range runs from $0.2M to $1,697.5M and a linear axis would flatten every early stage to nothing. Source: KPMG Venture Pulse Q2 2026, pp. 9 and 10.
| Series | Median deal size ($M) | Median pre-money valuation ($M) |
|---|---|---|
| Angel | 0.2 | 3.6 |
| Pre-seed | 0.5 | 6.3 |
| Seed | 2.7 | 14.1 |
| Series A | 14.5 | 55.8 |
| Series B | 29.0 | 166.5 |
| Series C | 50.0 | 458.0 |
| Series D+ | 121.7 | 1,697.5 |
A median seed round is $2.7 million. A median Series D+ company is priced at $1.7 billion before the round opens. Those two companies share a market only in the sense that they appear in the same report.
If you are raising: name your ask against your own row, adjusted for sector and geography. If you are at seed asking four times the median, the deck has to carry a reason for the gap, and “the market is at a record” is not one.
If you are allocating: use the row as a first filter, not a verdict. A round far above its stage median is not automatically wrong, but it converts the deal into a bet on one specific reason for the premium. Make the founder name that reason before you take the meeting.
How to read a manager in a mark-heavy market
Which metrics matter now?
In a quarter where the largest liquidity headline in history was mostly a valuation, the natural reaction is to throw out valuation-based metrics. That is the wrong correction, and the institutions did not make it.
ILPA standardises the reporting of IRR and TVPI or MOIC alongside cash-flow data rather than in place of it. And in McKinsey’s survey of 300 large LPs, DPI is now tied with MOIC as the second most important metric shaping allocation decisions, with IRR still the leading focus.
The distinction that matters is not which metric to use. It is which part of the return each one describes. TVPI includes unrealised NAV. Interim IRR also depends on unrealised valuations. DPI excludes unrealised holdings entirely, which is exactly why it behaves differently in a year like this one.
In a mark-heavy market the question is not “what is your IRR?” It is “how much of that IRR has actually been realised?”
| Metric | What it measures | Moves when a mark moves? |
|---|---|---|
| DPI | Cash actually distributed, divided by cash paid in | No |
| RVPI | Remaining portfolio value, divided by cash paid in | Yes, entirely |
| TVPI (or MOIC) | DPI plus RVPI: realised and unrealised together | Yes, through the RVPI half |
| Net IRR, interim | Time-weighted return including current portfolio value | Yes |
Read the column on the right next to a quarter in which one listing produced $1.7 trillion of exit value. Three of these four measures can improve without a single dollar reaching an investor.
The context for that question: McKinsey reports DPI as a share of total private equity assets under management at about 6% for the twelve months to June 2025, against a 2015 to 2019 average of 16%, with five-year rolling DPI at its lowest recorded level. The counterweight, and it is a real one, is that buyout fund distributions exceeded capital calls in 2025 for the second year running.
If you are allocating: do not read IRR or TVPI in isolation, and do not discard them. Separate realised performance from marked performance: compare DPI, RVPI, TVPI and net IRR by vintage, then ask how much of the reported return still depends on unrealised NAV. Ask when the marks were last struck and by whom.
If you are raising: the same arithmetic explains why a partner who likes your company still says no. It is rarely the deck. Find out where the fund sits in its own cycle before you read the room as a rejection.
What the data cannot tell you
How do I choose one deal?
Everything above describes the weather. It tells you the market is concentrated, that a record exit figure is mostly a valuation, and that access is bifurcating rather than closing.
It does not tell you whether one specific company survives that. That comes down to whether the business reaches its next milestone without a new round, whether the plan was built from measured demand or from what the market might give, and whether the people running it have done this before when it was difficult.
This is why I would rather work inside a company for a year than read its deck for an hour. In a market this concentrated, most of what separates a good company from a good investment sits in things no dataset records.
If you are allocating: for the next deal, write down what would have to be true operationally for it to work before you open the projections. Then ask the founder for evidence on those specific points. If the evidence does not exist, you have learned the most important thing about the deal.
If you are raising: assume your next investor does exactly that. Prepare the operational evidence first and the narrative second, because in this market the narrative is the cheapest thing to produce and is therefore trusted least.
What this adds up to
The $1.9 trillion record tells us something important about venture capital. Just not what the headline suggests.
Capital is available. Liquidity is less certain. Valuations are high. Access is concentrating conventionally while widening structurally. And a handful of companies can now move an entire asset class’s statistics.
That makes aggregate numbers less useful, not more. For an investor the questions become narrower:
- How much of the return is realised?
- How dependent is it on a mark?
- Why am I being offered this particular deal?
- What am I paying relative to its stage and fundamentals?
- Who still owns it after the liquidity event?
- And what has to happen operationally for my return to exist?
A record market can still be a bad place to buy. A concentrated market can still contain exceptional investments.
The difference is underwriting.
Frequently asked questions
What was global venture-backed exit value in Q2 2026?
Global venture-backed exit value was $1.908 trillion in the second quarter of 2026, according to KPMG Venture Pulse Q2 2026. That single quarter exceeded the previous full-year record of roughly $1.5 trillion set in 2021.
Does a record exit value mean investors received that much cash?
No. Exit value is not cash returned to investors. PitchBook values a public-market exit using the company’s valuation at the IPO price rather than the cash raised in the offering, so a large exit-value figure can reflect valuations rather than distributions.
How does PitchBook calculate IPO exit value?
PitchBook computes IPO exit value from the company’s valuation at its IPO price and counts only the first majority liquidity event. The methodology is stated on page 99 of the KPMG Venture Pulse Q2 2026 report, which is built on PitchBook data.
How much did SpaceX actually raise in its IPO?
SpaceX raised $75 billion in the offering, rising to $85.7 billion after underwriters exercised the full over-allotment option, according to KPMG’s Q2 2026 press release. KPMG describes the quarter as heavily skewed by the merger of SpaceX and xAI and the subsequent listing of the combined company.
How much of Q2 2026 venture funding went to the ten largest deals?
The ten largest deals absorbed $105 billion of the $227.4 billion invested globally in Q2 2026, roughly 46% of all venture capital deployed that quarter, according to KPMG. CB Insights, using a separate database, reports that rounds of $100 million and above captured 81% of global funding in the same quarter.
Was 2026 a record year for venture funding?
Global venture funding reached $560.3 billion in the first half of 2026, which is more than the full-year total for 2022, 2023, 2024 or 2025. Only 2021, at roughly $750.8 billion, was larger. Deal count over the same period was at a decade low, so the record reflects larger cheques rather than more financings.
Did the number of venture exits fall in Q2 2026?
KPMG reports 811 venture-backed exits in Q1 2026 and 775 in Q2 2026 as first published, an apparent 4.4% decline. That difference is too small to establish direction, because private-market counts are revised upward for months: KPMG’s Q1 2026 deal count moved from 8,464 to 10,277 between data vintages.
Which metrics should investors use to evaluate a venture fund in 2026?
DPI, RVPI, TVPI and net IRR should be read together rather than in isolation. DPI measures cash actually distributed relative to cash paid in and does not move when a portfolio mark moves; TVPI and interim IRR both include unrealised value. ILPA standardises the reporting of IRR and TVPI alongside cash-flow data rather than in place of it.
Is it becoming harder to access private companies?
Access is splitting rather than closing. US venture fundraising rebounded in the first half of 2026 but remained concentrated among established managers, according to NVCA. At the same time private equity secondaries reached a record $240 billion in 2025, up 48%, with GP-led volume at $115 billion, according to McKinsey citing Jefferies.
Appendix: can you trust these numbers?
Nine circulating figures did not survive verification while this piece was being assembled. Two of them were ours, and one of those was published on an earlier version of this page before we caught it.
| # | Circulating figure | Verified | Why it failed |
|---|---|---|---|
| 1 | 2020 exit value $522.4B | $622.4B | The Q3 2020 chart label reads $236.5B, not $136.5B, giving 69.9 + 85.5 + 236.5 + 230.5 = 622.4. The labels on p.14 are rotated 90° and are invisible to ordinary PDF text extraction, which is how a digit gets dropped. The widely repeated “correction” to $522.4B is itself the error |
| 2 | H1 2026 total $560.4B or $560.3B | Both official | The same KPMG release uses both. Rounding, not error |
| 3 | 2021 annual $750.8B or $750.9B | Neither is printed | Ours. Our sum of chart labels gives 750.8; KPMG’s press release says 750.9 from unrounded data |
| 4 | Q1 2026 funding $330.9B | $332.9B | Revised between vintages |
| 5 | Q1 2026 deal count 8,464 | 10,277 in the latest vintage | Late reporting, a 21% revision. Vintages must not be mixed |
| 6 | Q2 2026 deal count 8,440 or 8,467 | 8,440 in the report | Both appear in KPMG’s own materials. The report notes counts are partly estimated |
| 7 | +136% YoY, +128% HoH | +118.1%, +123.0% | Does not reproduce from the current vintage. It does reproduce from a mid-2025 vintage, so it is a vintage artefact rather than an invention |
| 8 | Annual totals presented as KPMG data | Derived sums | The report prints no annual totals |
| 9 | Exit count fell 4.4% in Q2 2026 | Unresolved | Ours, published and then withdrawn. It compared a revised quarter with a first-print one inside a series that revises by double digits |
How independent are the sources?
Almost every venture statistic in circulation traces to fewer databases than the bylines suggest, and we got this wrong in the first version of this page.
KPMG’s Venture Pulse is built on PitchBook data: every chart is sourced to “KPMG Private Enterprise analysis of PitchBook data.” The PitchBook-NVCA Venture Monitor is PitchBook. The J.P. Morgan venture commentary widely quoted alongside them is published inside the Venture Monitor. Of the four names most often listed as corroborating this year’s picture, three are one database. CB Insights is the genuinely independent second reading, which is why its agreement on concentration and deal count carries the weight it does here.
Both: when a claim is supported by several sources, check whether they share a data provider before treating the agreement as confirmation. Search the report for the phrase “analysis of” and read the methodology page. Two reports from one database are one data point.
In our own review, roughly one figure in three did not survive tracing to source in the form it was circulating. If you find a tenth error on this page, send it and it will be credited here.
Sources
- KPMG Venture Pulse Q2 2026 — funding p.7, deal sizes p.9, valuations p.10, exit values p.14, methodology and exit definitions p.99. Built on PitchBook data
- KPMG Q2 2026 press release — exit counts, top-ten concentration, the US and public-listing split, SpaceX and xAI
- KPMG Q1 2026 press release — as-published Q1 figures used in the register
- CB Insights, State of Venture Q2 2026 — independent database, deal count and mega-round share
- PitchBook-NVCA Venture Monitor — fundraising rebound and concentration, United States
- Q4 2025 PitchBook-NVCA Venture Monitor — US unicorn aggregate value, read on the open report page
- McKinsey Global Private Markets Report 2026, Private Equity — secondaries and GP-led volume (citing Jefferies), DPI as a share of AUM, and the survey of 300 LPs. Private equity scope, not venture
How every figure on this site is checked, labelled and retired → | Thirty verified venture figures, and five that are wrong →